Labour Underutilization: Concept and Measurement (3/3)

Section 3: Some Lessons from the 2012 Sakernas

As discussed above, the Sakernas (until 2015) is unable to provide data on “potential labour force” (PLF), the second component of the labour underutilized” (LU). The reason for this is that the questionnaire of the survey does not contain the question of “the availability of work”. However, part of PLF (using ICLS-19 standard) has been included already in the unemployment rate; namely, “discouraged job seeker” (DJS).

The estimated population of DJS, according to Sakernas 2012, is around 2.26 million. This is a big number as reflected in the DRS-unemployment ratio which is about 31:100. The table also shows some numbers that can be used to estimate population or ratios of some components of Working-age Population (WAP) as below:

  • Unemployment (U) = 7.2 million, if DJS is considered as part of U (as official figure); OR 5.0 million, if DJS if DJS is considered as part of “Outside LF)” (as suggested by ICLS-19);
  • Unemployment rate= 6.1% or 4.3%; depending on how to treat DJS;
  • Time-related Underemployment (TRU) = 11.5 million
  • Labour Underemployment (LU) >= 18.8 million, if LU>=U+TRU, and
  • LU rate >= 15.9%, if LU rate = (LU/Labour Force) *100.

[Beck to Section 1]

Labour Underutilization: Concept and Measurement (2/3)

Preliminary notes:

The concept of labour underutilization as discussed in the first section is the product of the resolution of  ICLS-19 hosted by ILO aimed mainly to be used as global guidelines in the area of labour statistics.  However, as a product of an ILO resolution, the concept is not binding for the participating countries of ILO. They might not be able to promptly follow the guidelines for practical reasons and hence need some time to apply in their actual survey. Part of the reasons for the participating countries are: (1) the need to “harmonize” the concept with actual situation of labour market they face, (2) the need to maintain “consistency” (as opposed to “validity”) of labour statistics between years to avoid confusion among data users, (3) the need test carefully the practicality of the concept in actual survey, and (4) the need to follow their own priorities in statistical activities. 


Section 2: Data Availability

At first glance, it appears to be that all the proposed components of “labour underutilization” as outlined in Section 1 are readily produced by a standard labour force survey. However, that is not fully the case, at least in the case of Indonesia. Here is a brief description on that issue.

Until 2015[1], the questionnaire of Sakernas, or Indonesia Labour Force Survey (ILFS) has no question on “the availability of work”. (What is available is a question on “the readiness to accept an offer for more job” that is intended to capture “time-related underemployment” as discussed in Section 1.)

In order to produce official statistics on unemployment, Sakernas defines unemployment put simply as:

(“Not in employment”) & ((“Seeking work”) OR (“Not seeking work due “Future start”” OR “Discouraged”)).

The above definition results in the figure of unemployment as mentioned in Section 1. The definition clearly shows that “availability for work” is ignored in defining “unemployment”.

The above definition “correctly” includes “future start” (not seeking because of having a job already) but “wrongly” includes “discouraged” (not seeking because of feeling there is no opportunity) in the unemployment. According to ICLS-19, “discourage” job seeker belongs to “outside labour fore” category, not “unemployment” (hence not in “labour force” category). In other word the official statistics of unemployment of Indonesia has in fact already included “discouraged” component of “outside labour force” (per ICLS-19 standard). As will be shown soon in Section 3, this component is relatively big, roughly 31% of the unemployment in 2012.

[1] Since 2016 BPS has initiated to improve the Sakernas questionnaire in order to address most of the issues raised by ICLS-19. Processes to refine the questionnaire toward this direction are still in place, until now.

[Proceed to Section 3: Sekernas’ Lessons]


Source: Google


Labour Underutilization: Concept and Measurement (1/3)

Section 1: Unemployment and Labour Underutilization

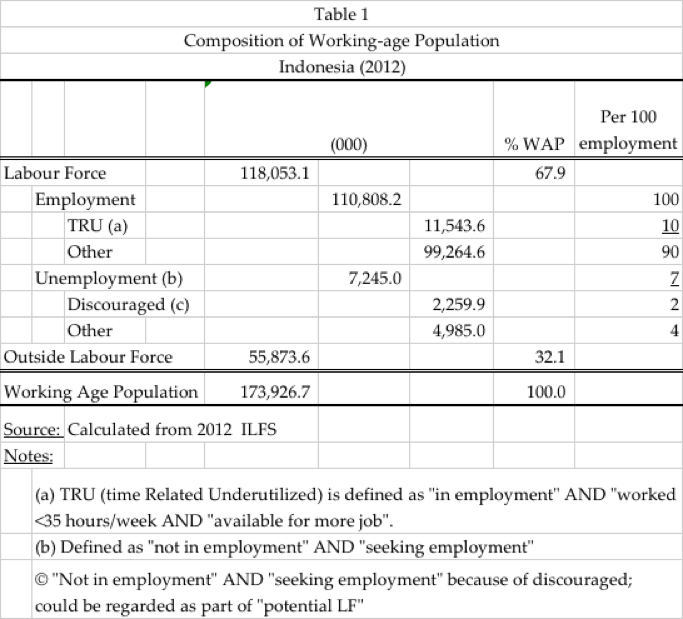
According to Sakernas 2018 or the 2018 Indonesia’s Labor Force Survey, the estimated total of the working age population (WAP) of Indonesia (2018 ILFS) is around 194.8 million. Out of the total, 131 million are classified as labor force (LF) and seven million are the unemployed. The unemployment rate is then about 5.3%.

While many might view the unemployment rate is comparatively low, it is basically sensible given these two facts:

    • Around two-thirds of Indonesia’s employment are engaging in the informal sector, and
    • There are no social security systems applied for unemployment in this country.

In addition, given the big population of Indonesia, even such a low unemployment rate equivalent with 1.2 total population of Singapore. For further discussion on this see THIS.

Perhaps only a few (if any) who disagree on the importance of the statistics of the unemployment rate as is a leading indicator for labour market. Likewise, perhaps only a few who disagree with the notion that the unemployment rate alone already reflects the situation of the labour market appropriately.

Many believe that changes in the unemployment rate is an insensitive indicator to track the real situation in the labor market. The economic crisis, for example, this indicator does not provide a clear signal to policymakers to anticipate. In the case of the 1997 Indonesian crisis, as another example, “a puzzle” was even found: during the Mid 1997 period (before the crisis) and the end of 1998 (when peak of the crisis ended): the number of employment increased by about 1.5% and the number of unemployment decreased by 12.3% [1].

The question would be then what other statistical measures– beside unemployment rate– that can be used to reflect and monitor the dynamics of the labour market in clearer, more realistic, and more sensitive way. The 19th International Conference of Labour Statistician in 2013 (ICLS-19) accentuates such an issue and promote pose the concept of “labour underutilization” (LU).

ICLS-19 (Par. 40) proposes this concept that includes these three elements; namely, unemployment, time-related underemployment (TRU),  and potential labour force (PLF). Here are the definitions of them.

    1. Unemployment = (not in employment) AND ((seeking work AND available for work));
    2. TRU = (in employment) & ((worked less than a normal working hour) & (seeking and available for more job)).
    3. PLF (Pars. 51-55):
      • (not in employment) & ((seek empolyment) & (were not :currently available”)); i.e., unavailable job seekers, OR
      • (not in employment) & ((not “seek employument”) & (“currently available”)); i,e., available potential jobseekers.

These measures are

the basis to produce headline indicators for labour market monitoring. For more comprehensive assessment they can be used with other indicators relating to the labour market, …. in particular skill-related inadequate employment and income-related inadequate employment.. ” (Par. 41)

It is worth noting that while the first component mentioned above belongs to labour force, the third belongs to “outside labour force” as generally understood. A reference for ICLS-19 can be accessed HERE.

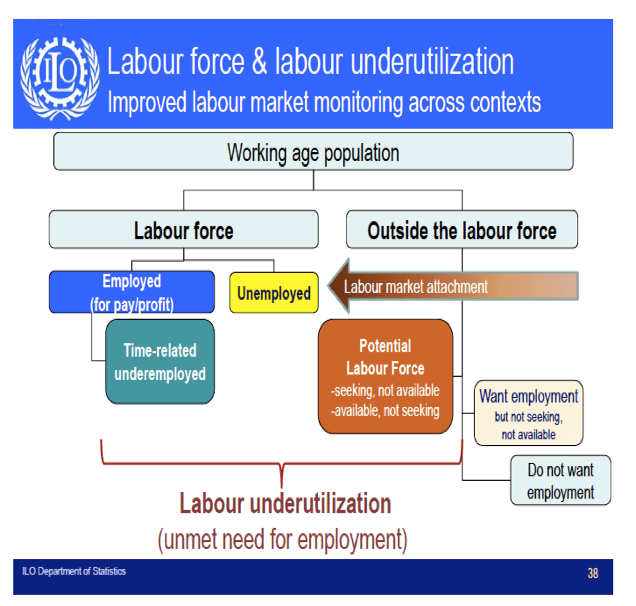
Graph 1 provides a schematic presentation of the components of LU as just mentioned. The graph shows among others that unemployment is only a fraction of a much larger LU category.

Graph 1: Composition of working age population

[1] Puguh Irawan and Uzair Suhaimi (1998:11) in Crisis, Poverty, and Human Development in Indonesia, BPS-UNDP.

[Proceed to Section 2: Data Availability]